Debugging CSS
Making errors is part of programming, and CSS is no exception...


Making errors is part of programming, and CSS is no exception. Even the most seasoned developers make mistakes, and the key lies in learning how to effectively debug and resolve these issues. In this blog post, we will explore the common errors that developers encounter in CSS and discuss practical steps to debug and rectify them. By understanding the root causes of CSS problems and employing the right techniques, you can enhance your skills in creating well-styled, error-free web pages.
Common CSS Errors
Before delving into the debugging process, let's first categorize the common CSS errors developers often encounter. These errors can be classified into three broad categories: skill-based, rule-based, and knowledge-based.
- Skill-based errors: These errors stem from typos or oversights, such as forgetting to include delimiters or neglecting to close brackets when applying styles to selectors.
- Rule-based errors: Rule-based errors occur when developers fail to adhere to CSS syntax rules. Examples include using class names that begin with numeric values or not following the specific syntax rules of layout techniques like Flexbox or CSS Grid.
- Knowledge-based errors: Knowledge-based errors arise when skilled developers haven't fully mastered the language yet. These errors can include using excessive selectors, resulting in over-specificity and negatively impacting performance.
Now, let's explore the steps you can take to effectively debug your CSS and resolve styling issues.
- Isolating the Culprit Elements
To uncover the root cause of a CSS issue, it's crucial to isolate the elements causing the problem. Most CSS issues are related to layout problems, such as misplaced elements or inconsistencies across browsers and devices. Identifying and isolating these elements is the first step toward resolving the issue.
2. Isolation by reduced case
To narrow down the problematic code, create a reduced case by removing any unrelated HTML, CSS, or JSX. You can also disable sections of your code and gradually enable them line by line to observe the changes and pinpoint the source of the problem.
3. Relocating items.
Similar to isolating elements, try relocating specific elements within your code to observe their behavior. By changing the position of an element and comparing the results, you can gain insights into the source of the problem. Remember that CSS compilers read elements from right to left, so altering the position of an element can aid in debugging.
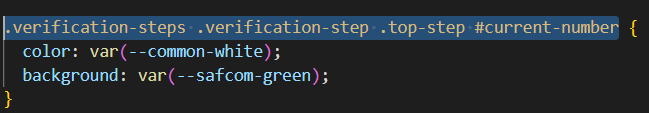
As an example, for a selector such as div .alpha > p, the compiler will read it as a p tag inside an alpha class element which is inside a div tag. When you change the position of the p from inside the .alpha class to some other position inside your code, it is easier to debug the source of the problem.
4. Understanding the box model
A thorough understanding of the box model is essential for effective CSS debugging. The box model, encompassing margin, border, and padding, plays a fundamental role in CSS styling. By familiarizing yourself with the box model, you can better identify and resolve many styling issues.
Browser issues. Different browsers render our styling differently. This is because browsers have their own default stylesheets called user-agent styles. To override these inconsistencies you should consider resetting your CSS to provide cross-browser consistency. A good resource I use when writing vanilla CSS is Normalize CSS. For example, it resets the margin, padding to zero, and the box-sizing property to border-box.
5. Leverage Browser Dev Tools
Browser Dev Tools are invaluable resources for debugging front-end issues, including CSS problems. Access the Dev Tools by right-clicking on a webpage and selecting the "Inspect Element" option. Within the Dev Tools, you can explore various features such as computed layouts, page and grid overlays, and font analysis.
Dev Tools allow you to make live changes to your code, enabling you to experiment and observe the effects in real-time. You can modify styles, test different property values, and even toggle responsive design modes to preview how your webpage appears on different devices or browsers.
On Chrome for example you will right-click on the page you want to inspect and select the inspect elements option at the bottom. Then on the developer tools window, it will default to the elements tab.
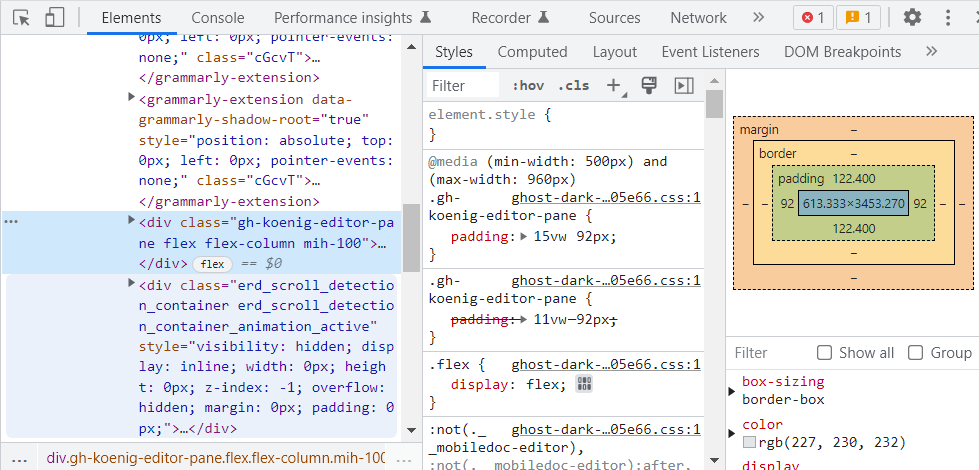
Inside the Elements tab, on the right-hand side, you will find several options such as Computed layouts that will show the box model of the selected element, Layouts that contain page and grid overlay options, and Font.
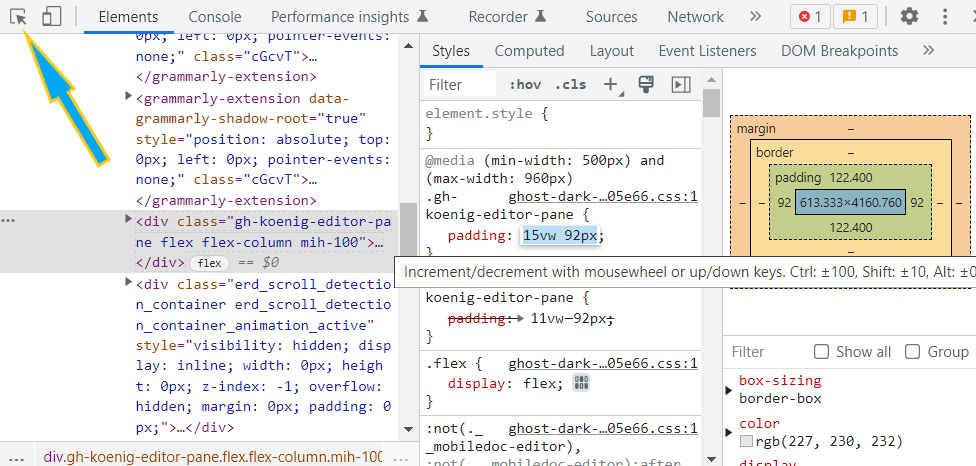
You can select a specific element using the ‘Element selection’ icon at the top left indicated by a cursor inside a box.
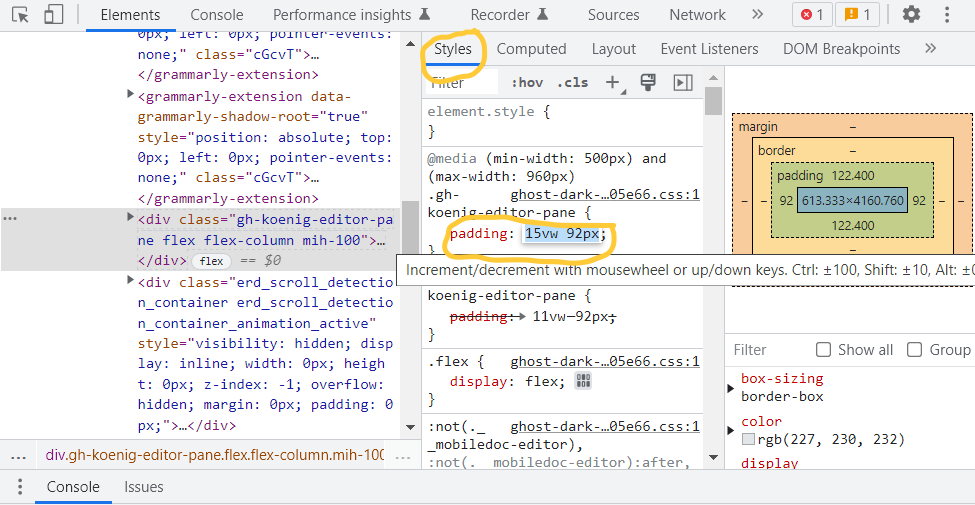
One very useful feature is the ability to make changes in your code directly inside the browser. On the dev tools, under the styles tab, you can see the different styles applied to your selected item. If you click on the values of the property you want to change, you can key in your desired values and see live updates. On some numeral values, a slider appears and you can slide the value and see the change as it happens.
There are also responsive design modes in CSS that allow you to toggle the device toolbar and render your webpage to a specific browser or device. The tab for this is next to the specific element selector on the top left, the second one from the left to be precise.
Debugging CSS requires a combination of experience, knowledge, and the right tools. By isolating problematic elements, reducing the case, relocating items, understanding the box model, addressing browser inconsistencies, and utilizing browser Dev Tools, you can effectively debug CSS issues and create visually appealing, well-structured web apps. Remember, making errors is a natural part of programming, and the process of debugging serves as a learning experience so don't beat yourself up so much, give yourself time to grow as a developer.
That's all for this week, Happy coding!
If you find this article enjoyable and helpful, you subscribe to my newsletter, Just in Time, it's free and I can send you more nuggets of wisdom like this.